1975-present: High-D data visualization
It is harder to provide a succinct overview of the most recent developments in data visualization, because they are so varied, have occurred at an accelerated pace, and across a wider range of disciplines. It is also more difficult to highlight the most significant developments (and because we have focused on the earlier history), so there are presently areas and events unrepresented here.
With this disclaimer, a few major themes stand out
- the development of a variety of highly interactive computer systems and more importantly,
- new paradigms of direct manipulation for visual data analysis (linking, brushing, selection, focusing, etc.)
- new methods for visualizing high-dimensional data (grand tour, scatterplot matrix, parallel coordinates plot, etc.)
- the invention of new graphical techniques for discrete and categorical data (fourfold display, sieve diagram, mosaic plot, etc.), and analogous extensions of older ones (diagnostic plots for generalized linear models, mosaic matrices, etc.) and
- the application of visualization methods to an ever-expanding array of substantive problems and data structures.
These developments in visualization methods and techniques arguably depended on advances in theoretical and technological infrastructure. Some of these are: (a) large-scale software engineering; (b) extensions of classical linear statistical modeling to wider domains; (c) vastly increased computer processing speed and capacity, allowing computationally intensive methods and access to massive data problems.
In turn, the combination of these themes and advances now provides some solutions for earlier problems.
Weekly chartbook (eventually computer-generated) to brief U.S. President, Vice President on economic and social matters
References:
 Fourfold display
 Stephen Fienberg portrait
 Cleveland portrait
 USA 1970 Draft Lottery Data, with median and quartile traces
Enhancement of scatterplot with plots of three moving statistics (midmean and lower and upper semimidmean)
References:
ClevelandKleiner:1975Experiment showing random permutations of features used in Chernoff's faces affect error rate of classification by about 25 percent
References:
ChernoffRizvi:1975
 Ehrenberg portrait
Experimental tests of statistical graphics vs tables, findings favoring latter
References:
Ehrenberg:1975 Ehrenberg:1977
 Enhanced scatterplot matrix
Scatterplot matrix, the idea of plotting all pairwise scatterplots for n variables in a tabular display
References:
Hartigan:1975Monthly chartbook (eventually computer-generated) to brief U.S. President, Vice President on economic and social matters (StatUS)
References:
USCensus:1976
 Wainer portrait
"Cartesian rectangle'' to represent 2 x 2 table, experimentally tested against other forms
References:
WainerReiser:1976Ad Hoc Committee on Statistical Graphics, leading to the ASA Section on Statistical Graphics, later to the Journal of Computational and Graphical Statistics
References:
Original invention of linked brushing (highlighting of observations selected in one display in another display of the same data), although in a manner different from how we see it in today's systems
References:
Newton:1978
![]() Boxplot of the NJ Pick-it Lottery
Boxplot of the NJ Pick-it Lottery
 Richard Becker portrait
 John Chambers portrait
S, a language and environment for statistical computation and graphics. S (later sold as a commercial package, S-Plus; more recently, a public-domain implementation, R is widely available), would become a lingua franca for statistical computation and graphics
References:
BeckerChambers:1978 BeckerChambers:1984 Becker:1994Geographic correlation diagram, showing the bivariate relation between two spatially referenced variables using vectors to represent geographic covariation
References:
Monmonier:1979An initial, modern suggestion of a method for viewing a large database by the use of selective focus around a central region, using distortion to provide a context.
References:
ApperleySpence:1980 ApperleyTzvarasSpence:1982
 Mosaic display á la Hartigan and Kleiner
 Hartigan & Kleiner 5-way mosaic of TV ratings (629 x 663; 105K)
Mosaic display to represent frequencies in a multiway contingency table
References:
HartiganKleiner:1984 Friendly:2002:mosahist HartiganKleiner:1981
 Fisheye view of central Washington, D.C.
Fisheye view: an idea to provide focus and greater detail in areas of interest of a large amount of information, while retaining the surrounding context in much less detail
References:
Furnas:1981The "draftsman display'' for three-variables (leading soon to the "scatterplot matrix'') and initial ideas for conditional plots and sectioning (leading later to "coplots'' and "trellis displays'')
References:
TukeyTukey:1981Another early version of brushing, invented independently of Newton, together with a system for 3-D rotations of data
References:
McDonald:1982
 Monmonier portrait
 US Visibility Map
Visibiltiy Base Map, a map of the United States where areas are adjusted to provide a readily readable platform for area symbols for smaller states, such as Delaware and Rhode Island, with compensating reductions in the size of larger states
References:
MonmonierSchnell:1983
 image
image
 George Rorick portrait
 image
image
The USA Today color weather map begins an era of color information graphics in newspapers. Shortly, colorful visual graphics become widespread.
Rorick used a combination of color, maps, tables, symbols and annotation to transform often dull and incomprehensible information into something more interesting and accessible
References:
 Tufte portrait
Esthetics and information integrity for graphics defined and illustrated (some concepts: "data-ink ratio'', "lie factor'')
References:
Tufte:1983 Tufte:1990 Tufte:1997
 Riedwyl portrait
![]() Sieve diagram image
Sieve diagram image
Sieve diagram, for representing frequencies in a two-way contingency table
References:
RiedwylSchupbach:1983Grand tour, for viewing high-dimensional data sets via a structured progression of 2D projections
References:
Asimov:1985
 Representation of a six dimensional point in parallel coordinates
 AlInselberg portrait
 Parallel coordinates plots for high-dimensional data
Parallel coordinates plots for high-dimensional data
References:
Inselberg:1989 InselbergDimsdale:1990 Inselberg:2009 Inselberg:1985
 Figure 14 from "Brushing scatterplots'' showing interactive labeling of brushed points
Interactive statistical graphics, systematized: allowing brushing, linking, other forms of interaction
References:
BeckerCleveland:1987
 Buja portrait
First inclusion of grand tours in an interactive system that also has linked brushing, linked identification, visual inference from graphics, interactive scaling of plots, etc.
References:
Buja-etal:1988
 DiamondFast image, overlaid time series, aligned and rescaled interactively
 Unwin portrait
Interactive graphics for multiple time series with direct manipulation (zoom, rescale, overlaying, etc.)
References:
UnwinWills:1988
 REGARD image: largest annual oil flows into EU, 1977--1990
Unwin portrait
Statistical graphics interactively linked to map displays
References:
Wills-etal:1989 Monmonier:1989
 TempleMVV image: 4 response variables vs. age, sex, education
 TempleMVV image: 4-way association
Use of "nested dimensions'' (related to trellis and mosaic displays) for the visualization of multidimensional data. Continuous variables are binned, and variables are allocated to the horizontal and vertical dimensions in a nested fashion
References:
Mihalisin-etal:1989 Mihalisin-etal:1992
 Luke Tierney portrait
Lisp-Stat, an object-oriented environment for statistical computing and dynamic graphics
References:
Tierney:1990


Mosaic display developed as a visual analysis tool for log-linear models (beginning general methods for visualizing categorical data)
References:
FriendlyFox:1991 Friendly:1994a
 Ben Shneiderman portrait
 TreeViz image of files on the HCIL server
Treemaps, for space-constrained visualization of hierarchies, using nested rectangles (size proportional to some numerical measure of the node)
References:
Shneiderman:1991 JohnsonShneiderman:1991
 Swayne portrait
 Young portrait
A spate of development and public distribution of highly interactive systems for data analysis and visualization, e.g., XGobi, ViSta
References:
Swayne-etal:1991 Buja-etal:1996 Swayne-etal:1998 Young:1994Beginnings of the general extension of graphical methods to categorical (frequency) data
References:
Friendly:1992 Friendly:2000:VCD
 Table lens screen shot
Table lens: Focus and context technique for viewing large tables; user can expand rows or columns to see the details, while keeping surrounding context
References:
RaoCard:1994
 Jason Dykes portrait
Cartographic Data Visualiser: a map visualization toolkit with graphical tools for viewing data, including a wide range of mapping options for exploratory spatial data analysis
References:
Dykes:1996
 Minard's March on Moscow graphic
 Wilkinson Portrait
Grammar of Graphics: A comprehensive systematization of grammatical rules for data and graphs and graph algebras within an object-oriented, computational framework
References:
Wilkinson:1999 Wilkinson:2005
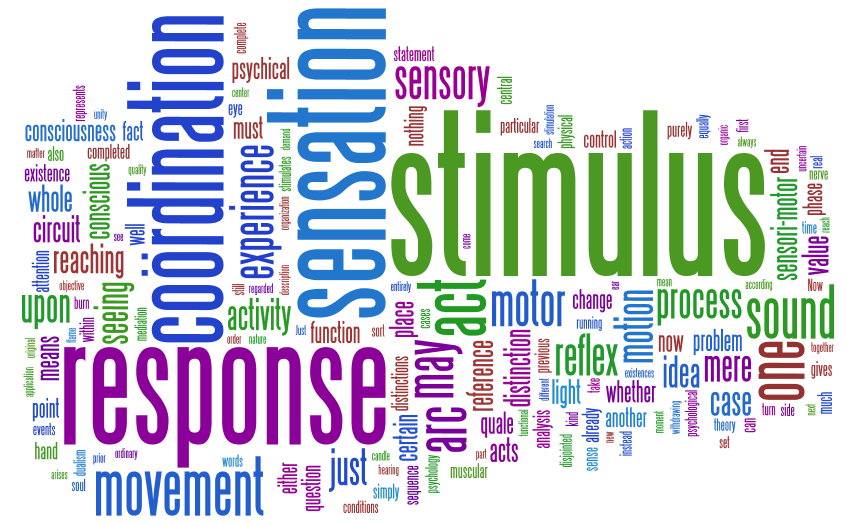 Wordle of Dewey's Reflex Arc Article.
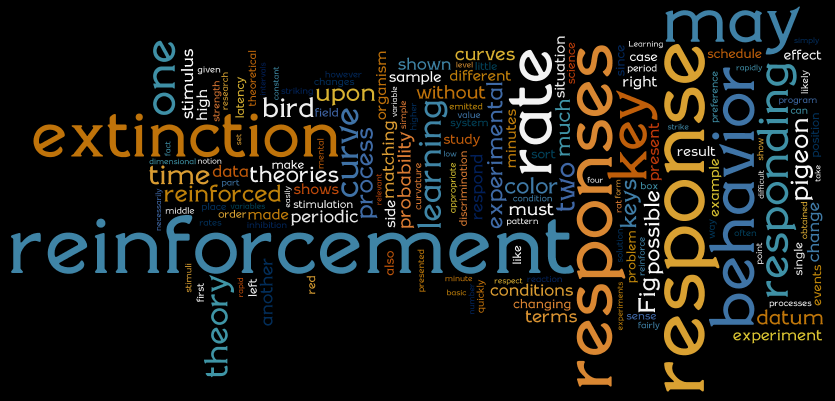 Wordle of Skinner's Theories of Learning article.
 Wordle of the Milestones Project.
Tag clouds (also known as "word clouds") are visually stimulating summaries of large bodies of text. Their purpose is to take a selection of text and visually display the frequency of the most commonly used words within that document. These are useful for qualitative analyses by highlighting major themes found in particular works of interest.
Many sources cite Jim Flanagan as the founder of this idea with his Search Referral Zeitgeist Perl script, although the basic idea (of using word size to designate importance) had previously been used by Douglas Coupland in his 1995 novel "Microsurfs". Tag clouds are prominently featured on image/photo websites (such as Flickr), and blogs, where they can be used by visitors to navigate the website by theme or keyword. For an example of a more academic use of this technology, see the attached photos, which were generated by Dr. Christopher Green of York University using the Wordle.com website. These images (made using John Dewey's 1896 article "The Reflex Arc Concept in Psychology" and B. F. Skinner's 1950 article, "Are Theories of Learning Necessary?") can be studied to visually compare and summarize the similarities and differences in word usage between these two major psychological texts.
References:
 Sparkline of the US deficit, 1983--2003
 Sparkline graphic for 4 stocks
Sparklines: "data-intense, design-simple, word-sized graphics,'' designed to show graphic information inline with text and tables
References:
Tufte:2006
 Buble chart for HIV
 Buble chart for the World
 Hans Rosling
The moving buble chart.
"The main innovation from Gapminder is so far 'the moving bubble chart' in the form of the Trendalyzer software that was acquired by Google in 2007. Google has made a 2008 version freely available as Google Motion Chart. Gapminder is a non-profit foundation founded in 2005 with a goal of '…increase use and understanding of statistics and other information about social, economic and environmental development at local, national and global levels.” (Rosling and Johansson, 2009).
References:
Rosling:2009
 ggplot2 plot of the diamonds dataset
An influential, open source implementation of the Grammar of Graphics from Wilkinson (1999) in R, together with other computational tools to make it easier to produce beautiful statistical diagrams
Around this time, software for producing statistical graphs progressed from limited point-and-click interfaces and low-level graphics languages to higher-level computational languages for specifying a graph. This item recognizes the work of Hadley Wickham in the ggplot2, plyr and other R packages, but there are a number of other important contributors to this topic.
References:
Wichham:2010
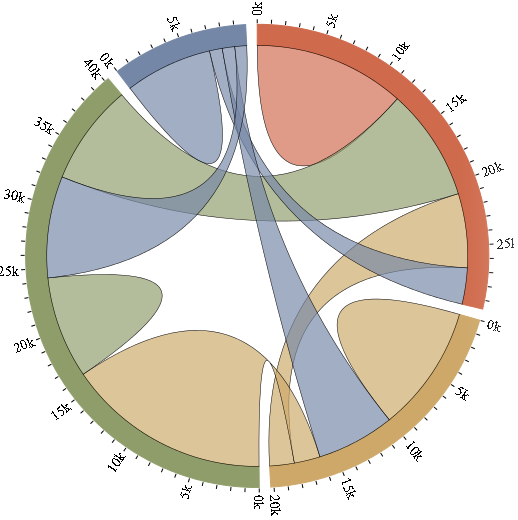 Circos-D3
 Circos sample panel
A circular diagram desgined to facilitate the analysis of relationship among categorical and other variables using chords of a circle with various visual attributes. The main application is to genomic structure, where the chords can encode various properties of genomic sequences.