A contingency table in frequency form (e.g., the output from PROC FREQ),
or raw data, where there is one variable for each factor. In frequency
form, there will be one observation for each cell.
For this form, specify:
TABLES=A B C
Include the WEIGHT= parameter when the observations are in frequency form.
Method
Usage
The CORRESP macro is called with keyword parameters. Either the
VAR= parameter or the TABLES= parameter (but not both) must be specified, but other parameters or options
may be needed to carry out the analysis you want. The arguments may be
listed within parentheses in any order, separated by commas. For example:
%corresp(var=response, id=sex year);
The plot may be re-drawn or customized using the output OUT=
data set of coordinates and the ANNO= Annotate data set.
- DATA=
-
Specifies the name of the input data set to be analyzed. [Default:
DATA=_LAST_]
- VAR=
-
Specifies the names of the column variables for simple CA, when the data
are in contingency table form. Not used for MCA.
- ID=
-
Specifies the
name(s) of the row variable(s) for
simple CA. Not used for MCA.
- TABLES=
-
Specifies the names of the factor variables used to create the rows and
columns of the contingency table. For a simple CA or stacked analysis, use
a ',' or '/' to separate the the row and column variables.
- WEIGHT=
-
Specifies the name of the frequency (WEIGHT) variable when the data set is in frequency form. If WEIGHT= is omitted, the observations in the input data set are not weighted.
- SUP=
-
Specifies the
name(s) of any variables treated as
supplementary. The categories of these variables are included in the
output, but not otherwise used in the computations. These must be included
among the variables in the VAR= or
TABLES= option.
- DIM=
-
Specifies the number of dimensions of the CA/MCA solution. Only two
dimensions are plotted by the PPLOT option, however.
- OPTIONS=
-
Specifies options for PROC CORRESP. Include
MCA for an MCA analysis, CROSS=ROW|COL|BOTH for stacked analysis of multiway tables, PROFILE=BOTH|ROW|COLUMN for various coordinate scalings, etc. [Default: OPTIONS=SHORT]
- OUT=
-
Specifies the name of the output data set of coordinates.
[Default:
OUT=COORD]
- ANNO=
Specifies the name of the annotate data set of labels produced by the
macro. [Default:
ANNO=LABEL]
- PPLOT=
-
Produce printer plot? [Default:
PPLOT=NO]
- GPLOT=
-
Produce graphics plot? [Default:
GPLOT=YES]
- PLOTREQ=
-
The dimensions to be plotted [Default:
PLOTREQ=DIM2*DIM1
when DIM=2, PLOTREQ=DIM2*DIM1=DIM3 when DIM=3]
- HTEXT=
-
Height for row/col labels. If not specified, the global HTEXT goption is
used. Otherwise, specify one or two numbers to be used as the height for
row and column labels. The HTEXT= option overrides the separate ROWHT= and COLHT=
parameters (maintained for backward compatibility).
- ROWHT=
-
Height for row labels
- COLHT=
-
Height for col labels
- COLORS=
-
Colors for row and column points, labels, and interpolations.
[Default:
COLORS=BLUE RED]
- POS=
-
Positions for row/col labels relative to the points. [Default:
POS=5 5]
- SYMBOLS=
-
Symbols for row and column points [Default:
SYMBOLS=NONE NONE]
- INTERP=
-
Interpolation options for row/column points. In addition to the standard
interpolation options provided by the SYMBOL statement, the CORRESP macro
also understands the option VEC to mean a vector from the origin to the row
or column point. [Default:
INTERP=NONE NONE, INTERP=VEC for MCA]
- HAXIS=
-
AXIS statement for horizontal axis. If both HAXIS= and
VAXIS= are omitted, the program calls the EQUATE macro to define suitable axis
statements. This creates the axis statements AXIS98 and AXIS99, whether or
not a graph is produced.
- VAXIS=
-
AXIS statement for vertical axis- use to equate axes
- VTOH=
-
The vertical to horizontal aspect ratio (height of one character divided by
the width of one character) of the printer device, used to equate axes for
a printer plot, when
PPLOT=YES. [Default: VTOH=2]
- INC=
-
X, Y axis tick increments (for the EQUATE macro). Ignored if HAXIS= and VAXIS= are specified. [Default:
INC=0.1 0.1]
- XEXTRA=
-
The number of extra X axis tick marks at left and right. Use to allow extra
space for labels. [Default:
XEXTRA=0 0]
- YEXTRA=
-
The number of extra Y axis tick marks [Default:
YEXTRA=0 0]
- M0=
-
Length of origin marker, in data units. [Default:
M0=0.05]
- DIMLAB=
-
Prefix for dimension labels [Default:
DIMLAB=Dimension when DIM=2, otherwise, DIMLAB=Dim]
- NAME=
-
Name of the graphics catalog entry [Default:
NAME=corresp]
Example
%include vcd(corresp);        *-- or include in an autocall library;
%include data(mental);
axis1 length=3 in  order=(-.15 to .15 by .10)
		label=(h=1.5 a=90 r=0);
axis2 length=6 in  order=(-.30 to .30 by .10)
		label=(h=1.5) offset=(1);
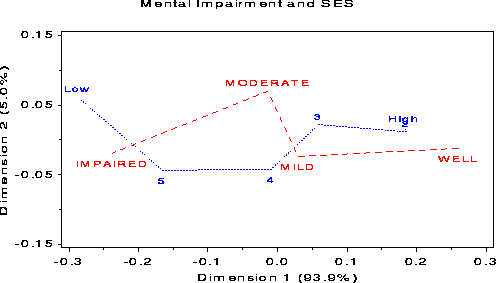
%corresp (data=mental, id=ses, var=Well Mild Moderate Impaired,
      vaxis=axis1, haxis=axis2, htext=1.3, pos=-, interp=join,
      symbols=triangle square);
 The CORRESP macro calls several other macros not included here. It is
assumed these are stored in an autocall library. If not, you'll have to
%include them in your SAS session or batch program.
- LABEL macro - label points
- EQUATE macro - equate axes
These are all available from http://www.datavis.ca/sas/vcd/macros/.
See also
biplot Generalized biplot of observations and variables
equate Creates AXIS statements for a GPLOT with equated axes
label Create an Annotate dataset to label observations
points Create an Annotate dataset to draw points in a plot
