| label |
Create an Annotate dataset to label observations |
label |
Visualizing Categorical Data: label
$Version: 1.7 (9 Jan 2002)
Michael Friendly
York University
Create an Annotate dataset to label observations
The LABEL macro creates an Annotate data set used to label observations in
a 2D (PROC GPLOT) or 3D (PROC G3D) scatterplot. The points which are
labeled may be selected by an arbitrary logical expression from those in
the input dataset. The macro offers flexible ways to position the text
label relative to either the data point or the center of the plot. The
resulting Annotate data set would then be used with the ANNO= option of PROC GPLOT or PROC G3D.
Values must be supplied for the X=, Y= and TEXT= parameters. For a PROC G3D plot, supply a value for the Z= parameter as well. The label macro is called with keyword parameters. The
arguments may be listed within parentheses in any order, separated by
commas. For example:
%label(x=age, y=response, text=name);
- DATA=
-
The name of the input data set [Default:
DATA=_LAST_]
- X=
-
The name of the X variable for the scatterplot
- Y=
-
The name of the Y variable for the scatterplot
- Z=
-
The name of the Z variable for a 3D scatterplot
- BY=
-
The
name(s) of any BY variable(s) to be used for
multiple plots.
- XOFF=
-
An X-offset for the text label. You may specify a numeric constant (e.g.,
XOFF=-1) in data units, or the name of a variable in the input data set. Positive
values move the label towards larger X values relative to the point;
negative values move it towards smaller X values..
- YOFF=
-
A Y-offset for the text label. Positive values move the label towards
larger Y values.
- ZOFF=
-
A Z-offset for the text label, for a 3D plot.
- TEXT=
-
The text used to label each point. TEXT= may be specified as a variable in the data set or a SAS expression
involving dataset variables (e.g.,
TEXT=SCAN(MODEL,1)) and/or string constants. If you supply an expression, use the
%str() macro function, e.g.,
TEXT=%str(trim(name || '-' || place)) to protect special characters.
- LEN=
-
Length of the TEXT variable [Default:
LEN=16]
- POS=
-
Specifies the position of the label relative to the data point. The POS= value can be a character constant (one of the characters in
``123456789ABCDE+'', as used by the Annotate POSITION variable), an expression involving
dataset variables which evaluates to one of these characters (e.g.,
POS=SCAN('9 1 3', _NUMBER_)) or one of the special characters, ``/'', ``|'', or ``-''. The special
position values cause the point label to be out-justified (moved outward
toward the edges of the plot relative to the data point.) by comparing the
coordinates of the pointto the mean of X and Y (/), or to the mean of X
only (|), or to the mean of Y only (-).
- SYS=
-
Specifies the Annotate XSYS & YSYS value [Default:
SYS=2]
- COLOR=
-
Label color (the name of a dataset character variable or a string constant
enclosed in quotes. [Default:
COLOR='BLACK']
- SIZE=
-
The size of label (in whatever units are given by the GUNIT goption). There
is no default, which means that the labels inherit the global HTEXT
setting.
- FONT=
-
The name of the font used for the label. There is no default, which means
that the labels inherit the global FTEXT setting.
- ANGLE=
-
Baseline angle for label.
- ROTATE=
-
Character rotate for label
- SUBSET=
-
An expression (which may involve any dataset variables) to select points. A
point will be labeled if the expression evaluates to non-zero for the
current observation. [Default:
SUBSET=1]
- COPY=
-
The names of any variables to be copied to output dataset
- IN=
-
The name of an optional input annotate data set. If specified, the IN= data set is concatenated with the
OUT= data set.
- OUT=
-
The name of the annotate data set produced. [Default:
OUT=_LABEL_]
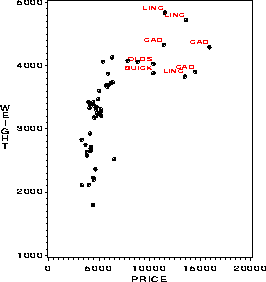
This example plots Weight against Price for American cars in the Auto data,
labeling the most expensive cars.
  %include vcd(label);        *-- or include in an autocall library;
  %label(data=auto, x=price, y=weight,
           color='red', size=1.2,
           subset=origin='A' and price>10000,
           pos=1, text=scan(model,1));

  proc gplot data=auto(where=(origin='A'));
     plot weight * price / frame anno=_label_;
     symbol1 v='+'  i=none color=black h=1.5;

See also
bars Create an annotate data set to draw error bars
boxanno Annotate a scatter plot with univariate boxplots
points Create an Annotate dataset to draw points in a plot
pscale Construct annotations for a probability scale
