DataVis.ca
Michael Friendly
York University

Early Medical Maps
Snow's (1855) map of areas served by the water companies of London
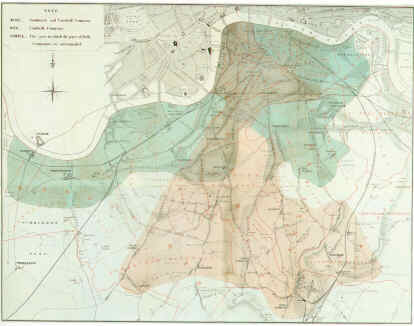
Prior to 1852, both companies had obtained their water from the heavily polluted river, but in 1852, the Lambeth Company changed to a source free of London's raw sewage. Snow analyzed the deaths from cholera according to these areas, shown in the map (green for Southwark and Vauxhall, beige for Lambeth), and controlled for population by expressing the death rate per 1000 inhabitants:
| Company | Deaths/1000 |
|---|---|
| Southwark | 71 |
| Lambeth | 5 |
He did not control for the greater proximity of the Southwark clients to the Thames, nor did he display disease incidence on the map, yet the visual evidence was clearly apparent.
Perry's (1844) map of incidence of an epidemic in Glasgow

He then
numbered the different districts on a map of the city .... marking with a darker shade those parts where the epidemic was most prevalent, which shows that those places most densely inhabited, by the poorest of people, have suffered most severely.Perry's map is also noteworthy in another respect, since the coloring of the map were
wholly the work of the inmates [of the Lunatic Asylum at Gartnavel]. It is hoped that this circumstance will induce the reader to make allowance for anything he may observe amiss in the manner in which this, their first essay, has been performed.
