DataVis.ca
Michael Friendly
York University

Title: Moseley's X-rays and atomic number
Author: Henry Moseley
Location: Oxford, UK
Year: 1913
The hallmark of good science is the discovery of laws which unify and simplify disparate findings and allow predictions of yet-unobserved events or phenomena. Mendeleev's periodic table, for example, allowed him to predict the physical and chemical characteristics of Gallium (Ga) and Germanium (Ge) before they were discovered decades later.
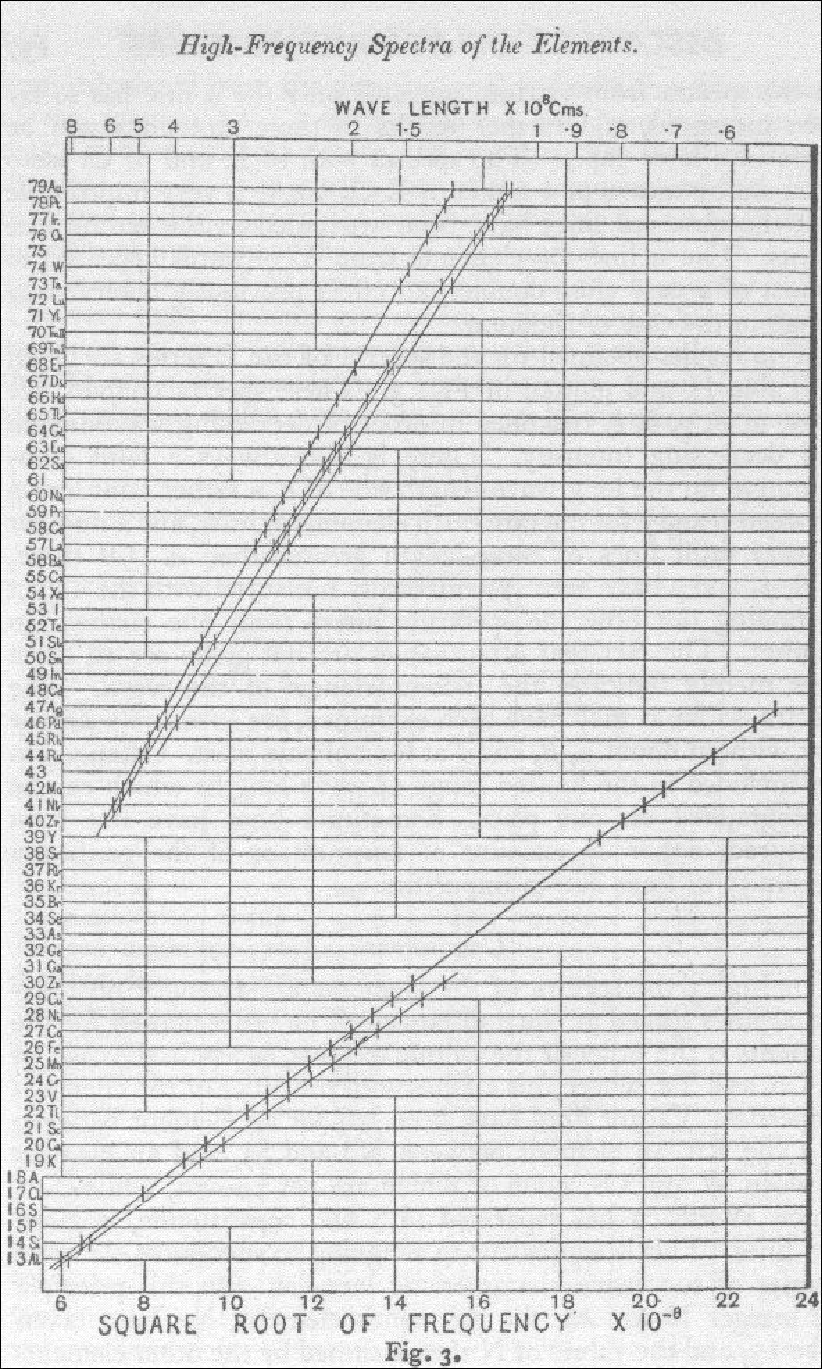
Mendeleev's table, however, arranged the elements only by a serial number, denoting an atom's position in a list arranged by increasing atomic mass. This changed in 1913-14 when Henry Moseley investigated the characteristic frequencies of X-rays produced by bombarding each of the elements in turn by high energy electrons. He discovered, that if the serial numbers of the elements were plotted against the square root of frequencies in the X-ray spectra emitted by these elements, all the points neatly fell on a series of straight lines.
This must mean that the atomic number is more than a serial number; that it has some physical basis. Moseley proposed that the atomic number was the number of electrons in the atom of the specific element.
Moseley's graph represents an outstanding piece of numerical and graphical detective work. He noted that there were slight departures from linearity which he could not explain; nor could he explain the multiple lines at the top and bottom of the figure. The explanation came later with the discovery of the spin of the electron. See also, <a href="http://www.physics.ox.ac.uk/History/Moseley.html">The Story of Moseley and X-rays.</a>
Ref: Henry Moseley, 1913. The high frequency spectra of the elements. Philosophical Magazine, 1913, 26, 1024--1034.
 Except where otherwise noted, the Gallery of Data Visualization by
Michael Friendly is licensed under a
Except where otherwise noted, the Gallery of Data Visualization by
Michael Friendly is licensed under a Creative Commons Attribution-NonCommercial 3.0 License. Please cite any uses of this work as shown below.
Citation: Friendly, Michael (2001), Gallery of Data Visualization, Electronic document, http://www.datavis.ca/gallery/,