DataVis.ca
Michael Friendly
York University

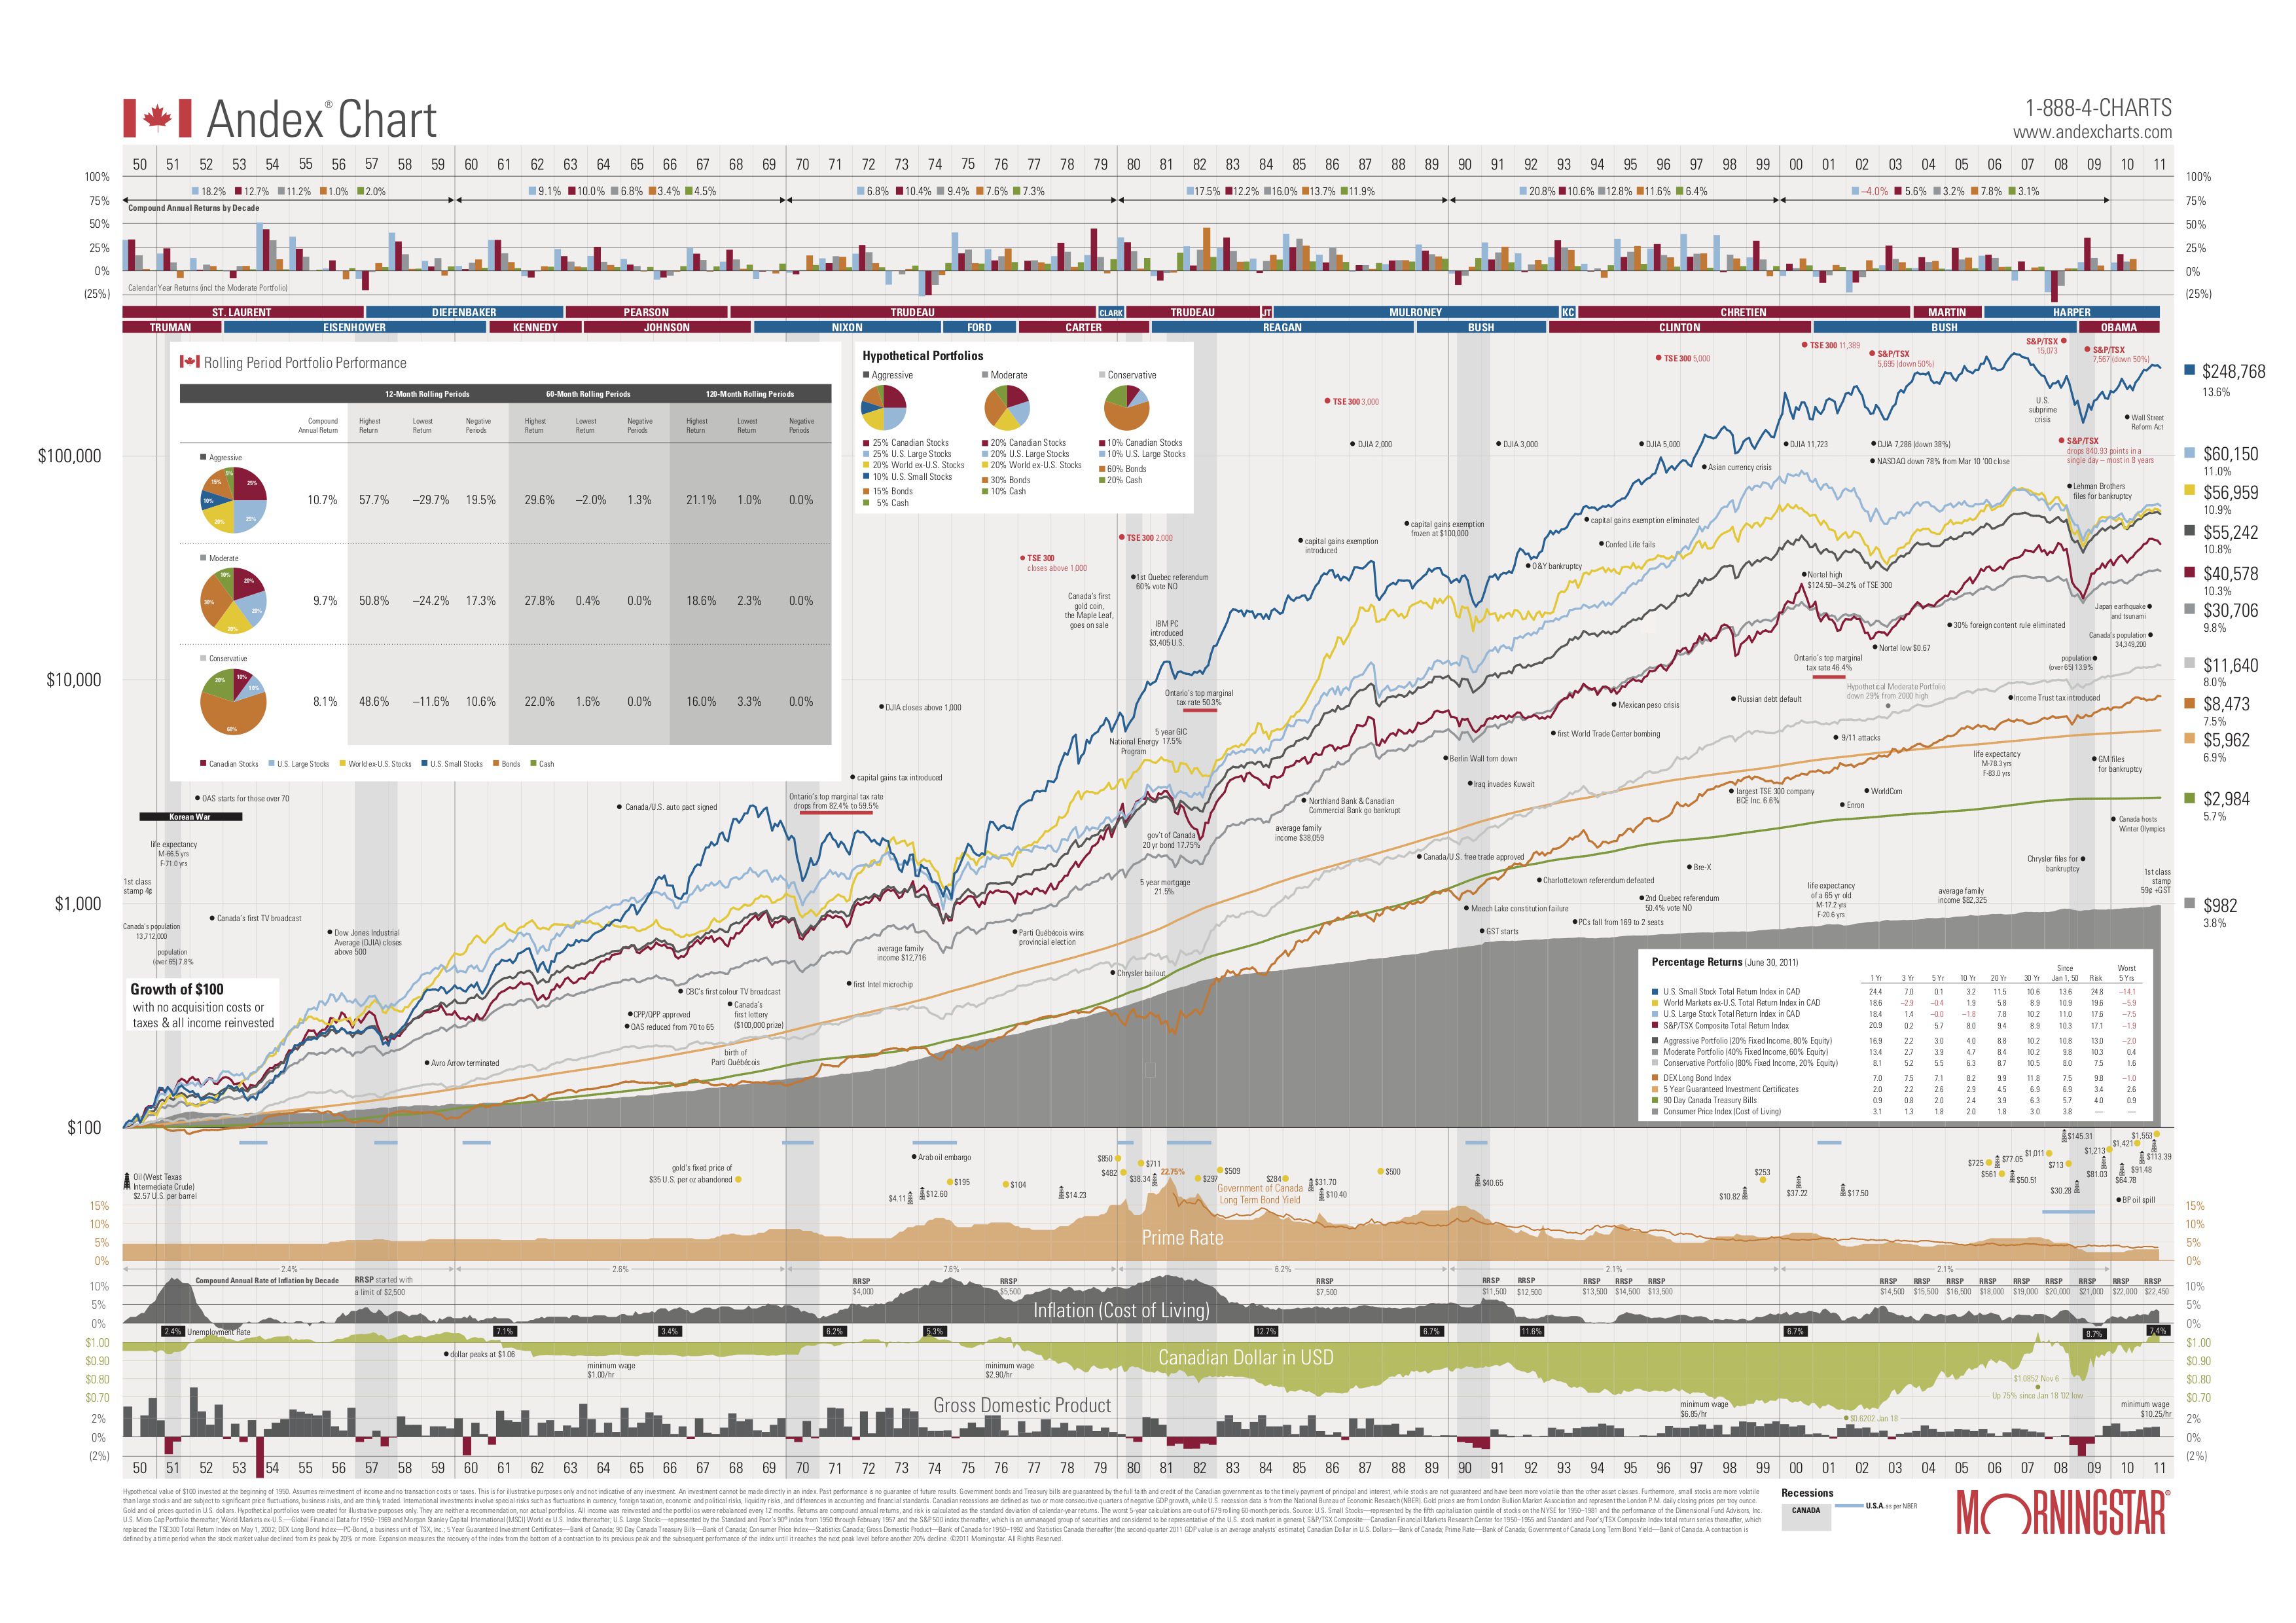
Title: Andex Chart
Author: Morningstar
Location: Toronto, Canada
Year: 2011
The Andex Charts are tools that help advisors communicate investment trends while setting appropriate risk and return expectations with clients. If you had invested in 1950 in securities included in the DEX Long Bond Index, would you be more or less rich in the early 80s?
This chart attempts to summarize multiple time series of percentage returns on investments over a long time period, and connect them with historical events (labeled points) and other economic indicators.
The main multiple lines graph and the box plots graph may be misleading however. When money is involved in time series, the baseline for returns should be the cost of living since 100$ are not worth the same now than in 1950.
Contributed by: Pere Millán-Martínez
©2007.
 Except where otherwise noted, the Gallery of Data Visualization by
Michael Friendly is licensed under a
Except where otherwise noted, the Gallery of Data Visualization by
Michael Friendly is licensed under a
Creative Commons Attribution-NonCommercial 3.0 License. Please cite any uses of this work as shown below.
Citation: Friendly, Michael (2001), Gallery of Data Visualization, Electronic document, http://www.datavis.ca/gallery/,
Except where otherwise noted, the Gallery of Data Visualization by
Michael Friendly is licensed under a Creative Commons Attribution-NonCommercial 3.0 License. Please cite any uses of this work as shown below.
Citation: Friendly, Michael (2001), Gallery of Data Visualization, Electronic document, http://www.datavis.ca/gallery/,